
With the massive crisis in the Ukraine and the sanction put on Russia has made the Russian stock exchange more undervalued even it already was. Currently the Russian stock exchange has a P/E ratio of .5.30x and has a cyclically adjusted P/E of 7.69. Russia is the second most undervalued markets in the world right behind Greece. Russia's top three oil and gas companies are all selling from around 5x to 2x their earnings far below the their averages over the last 10 years. Jim Grant owns all three which includes Gazprom and is very bullish on Russia as a whole.
Gazprom
Thanks to the Ukraine crisis and sanction put on Russia by the United States, has made Gazprom (GZPFY) (OGZPY) already undervalued more undervalued. Gazprom is the largest producer of natural gas in the world and provides 1/3 of the gas consumed by the European Union and only sells for 3x its earnings. The company is more profitable than any American oil company but has a lower market cap. Gazprom almost has ten times the natural gas reserves of ExxonMobil (XOM) but sell for 3x earnings while Exxon sells for 12.4x.
Company history
- In 1989, the government transformed the Ministry of Gas Industry into Russia's first state-enterprise and called it State Gas Concern Gazprom. The government controlled the company by owning 100% of Gazprom stock.
- In 1991, the Soviet Union dissolved and the assets of the former Soviet state in the gas sector were transfered to new created National Corporations.
- In 1993, the government began to privative Gazprom. The company became a joint-stock company and started to distribute its shares under the voucher method. Every Russian citizen received vouchers to purchase share of the formly government owned enterprise.
- By 1994, the 33% of the company was owned by 747,000 citizens who used the voucher from the Government to buy those share. 15% of the shares where given an purchased an allocated to the company's employees. The Russian government retained 40% of the remaining shares.
- Over time the government gradually reduced its stake to 38%.
- Gazprom slowly grew its credibilty with western capital markets and offered one percent of its equity to foreign investors in Global Depository Receipts. Had a sucessful bond offering of 2.5 billion as well.
- When Vladimir Putin became president of Russia, he went on a campaign to rein in the oligards. He strength control of strategic companies that he saw as important to the nation of Russia.
- Putin clearly view Gazprom as one of these companies, and went about to expand government control of the company.
- The Government arranged multiple transactions with Gazprom subsidiaries to acquire 10.73% of Gazprom stock costing the government $7 billion. After the purchase was completed and combined with the states already 38% stake gave the government majority control of the company.
- After the government gain control over Gazprom, it removed the 20% restriction on foreign investors. This made the company fully open to foreign investors.
- In 2007, Russia's government passed a federal law on gas grants, which gave Gazprom exclusive rights to export natural gas.
- In May 2014, Gazprom and China's China National Petroleum Corporation made a 30 deal that is worth about $400 billion. According to the agreement Gazprom will deliver some 38 billion cubic meters of natural gas every year to eastern China. The first delivery is expected to start in 2018 four years from now.
Business overview
Gazprom is in the business of geological exploration, production, transportation, storage, processing and marketing. The company is second behind Saudi Aramco in supplying energy to the world in 2013. Gazprom produced an average of 8.1 million barrels of oil equivalent per day in 2013, far above the 5.3 million barrels of oil equivalents produced per day by ExxonMobil. The company alone produces 20% of all the natural gas consumed by nearly every nation in Europe except for Belgium, The Netherlands, Switzerland and the United Kingdom. Gazprom has essentially a monoply in many of the European countries. The company's reserves a lone are large enough to make the company one of event the largest energy company in the world. Gazprom has proven gas reserves of 18.99 trillion cubic meters at the end of 2010 and this is 9.3 times greater than the natural gas reserves of ExxonMobil. Over the last decade the company's gas production has been stable, producing about 500 billion cubic meters of natural gas per year. Gazprom also annually produces 32 million tons of cubic oil and 12 million tons of gas condensate. The major parts of the Gazprom production fields are located in the Nadym-Pur-Tarz region in Yamalo-Nenets Autonomous Okug in Western Siberia.
Finances
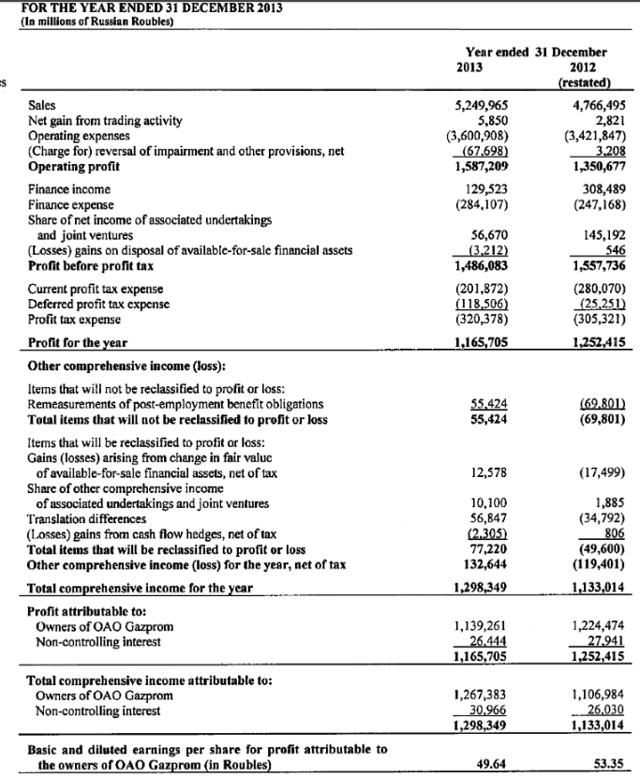
In 2013, Gazprom sales were approximately RUB $5.2 trillion and revenues were 3x that of ConocoPhilips (COP) even after the recent sharp decline in the Rouble. The company revenues in 2013 increased 10%. Revenues reflect Distribution Segment increase of 12% to RUB $2.963 Trillion. Gazprom Refining segment increased 12% to RUB $1.35 Trillion and Transportation segment increased 30% to RUB $163.27 billion. As well the company's Europe Natural Gas segment increased 17% to RUB $2.11 Trillion. The company had a net income of RUB $1.17 trillion or $32.9 billion that slightly higher than ExxonMobil's net income of $32.6 billion in 2013.
In the first quarter of 2014, Gazprom saw profits fall 41% from a year earlier mostly due to the events in the Ukraine. The company had to write-off 71.3 billion rubles or ($1.9) billion due to Ukraine's doubtful trade accounts. These write-offs were largely expected to happen. Ukraine's debt to Gazprom has risen to $5.4 billion and in June the company turned off its gas taps to Ukraine. Net profits for the first three months of the fell to $223 billion rubles and revenues were up 7% to $1.5 trillion rubles. Operating expensives climbed 15% to $1.09 trillion rubles
Balance Sheet
| 2013
31/12
| 2012
31/12
| 2011
31/12
| 2010
31/12
| ||||||||||||||||||||||||||||||||||||||||||||||
|---|---|---|---|---|---|---|---|---|---|---|---|---|---|---|---|---|---|---|---|---|---|---|---|---|---|---|---|---|---|---|---|---|---|---|---|---|---|---|---|---|---|---|---|---|---|---|---|---|---|
| Total Current Assets | 2862670 | 2420803 | 2248293 | 1865895 | |||||||||||||||||||||||||||||||||||||||||||||
| |||||||||||||||||||||||||||||||||||||||||||||||||
| Total Assets | 13436236 | 11956836 | 10786140 | 9235993 | |||||||||||||||||||||||||||||||||||||||||||||
| |||||||||||||||||||||||||||||||||||||||||||||||||
| Total Current Liabilities | 1391465 | 1492066 | 1311577 | 1011261 | |||||||||||||||||||||||||||||||||||||||||||||
| |||||||||||||||||||||||||||||||||||||||||||||||||
| Total Liabilities | 4116646 | 3786103 | 3513294 | 2986242 | |||||||||||||||||||||||||||||||||||||||||||||
| |||||||||||||||||||||||||||||||||||||||||||||||||
| Total Equity | 9319590 | 8170733 | 7272846 | 6249751 | |||||||||||||||||||||||||||||||||||||||||||||
| |||||||||||||||||||||||||||||||||||||||||||||||||
| Total Liabilities & Shareholders' Equity | 13436236 | 11956836 | 10786140 | 9235993 | |||||||||||||||||||||||||||||||||||||||||||||
| Total Common Shares Outstanding | 22977 | 22976 | 22947.51 | 22950.51 | |||||||||||||||||||||||||||||||||||||||||||||
| Total Preferred Shares Outstanding | - | - | - | - | |||||||||||||||||||||||||||||||||||||||||||||
Income Statements
| 2013
31/12
| 2012
31/12
| 2011
31/12
| 2010
31/12
| |||||||||||||||||||||||||||||||
|---|---|---|---|---|---|---|---|---|---|---|---|---|---|---|---|---|---|---|---|---|---|---|---|---|---|---|---|---|---|---|---|---|---|---|
| Total Revenue | 5255815 | 4769316 | 4637090 | 3597054 | ||||||||||||||||||||||||||||||
| ||||||||||||||||||||||||||||||||||
| Cost of Revenue, Total | 860335 | 920347 | 1090828 | 790562 | ||||||||||||||||||||||||||||||
| Gross Profit | 4395480 | 3848969 | 3390024 | 2682065 | ||||||||||||||||||||||||||||||
| Total Operating Expenses | 3668606 | 3418639 | 2980014 | 2482467 | ||||||||||||||||||||||||||||||
| ||||||||||||||||||||||||||||||||||
| Operating Income | 1587209 | 1350677 | 1657076 | 1114587 | ||||||||||||||||||||||||||||||
| Interest Income (Expense), Net Non-Operating | -101126 | 207059 | 22860 | 159116 | ||||||||||||||||||||||||||||||
| Gain (Loss) on Sale of Assets | - | - | - | - | ||||||||||||||||||||||||||||||
| Other, Net | - | - | - | - | ||||||||||||||||||||||||||||||
| Net Income Before Taxes | 1486083 | 1557736 | 1679936 | 1273703 | ||||||||||||||||||||||||||||||
| Provision for Income Taxes | 320378 | 305321 | 337494 | 275710 | ||||||||||||||||||||||||||||||
| Net Income After Taxes | 1165705 | 1252415 | 1342442 | 997993 | ||||||||||||||||||||||||||||||
| Minority Interest | -26444 | -27941 | -35424 | -29436 | ||||||||||||||||||||||||||||||
| Equity In Affiliates | - | - | - | - | ||||||||||||||||||||||||||||||
| U.S GAAP Adjustment | - | - | - | - | ||||||||||||||||||||||||||||||
| Net Income Before Extraordinary Items | 1139261 | 1224474 | 1307018 | 968557 | ||||||||||||||||||||||||||||||
| Total Extraordinary Items | - | - | - | - | ||||||||||||||||||||||||||||||
| Net Income | 1139261 | 1224474 | 1307018 | 968557 | ||||||||||||||||||||||||||||||
| Total Adjustments to Net Income | - | - | - | - | ||||||||||||||||||||||||||||||
| Income Available to Common Excluding Extraordinary Items | 1139261 | 1224474 | 1307018 | 968557 | ||||||||||||||||||||||||||||||
| Dilution Adjustment | - | - | - | - | ||||||||||||||||||||||||||||||
| Diluted Net Income | 1139261 | 1224474 | 1307018 | 968557 | ||||||||||||||||||||||||||||||
| Diluted Weighted Average Shares | 22900 | 22900 | 22900 | 22900 | ||||||||||||||||||||||||||||||
| Diluted EPS Excluding Extraordinary Items | 49.75 | 53.47 | 57.08 | 42.3 | ||||||||||||||||||||||||||||||
| DPS - Common Stock Primary Issue | 9.4 | - | 8.97 | 3.85 | ||||||||||||||||||||||||||||||
| Diluted Normalized EPS | 49.75 | 53.47 | 57.19 | 42.71 | ||||||||||||||||||||||||||||||
Valuation
Currently the company is selling for 3x its earning, 0.35x book value, and selling for 2.2x its pretax earnings. Gazprom is clearly undervalued compared to the rest of the industry. The firm has more then 9x the natural gas reserves of ExxonMobil and the company's revenues were 3x that of ConocoPhilips. Exxon and ConocoPhilips both sell for higher multiples than Gazprom despite having more natural gas than Exxon and more revenues than ConocoPhilips. Exxon and ConocoPhilips sell for 12x to 10x their earnings while Gazpron sells for 3x. Clearly Gazprom should trade for at least 10x the firm's earnings, which means that the firm would sell for $26.90 per share. The firm should also sell for 10x its pretax earnings – that's $35.18 per share. Exxon and ConocoPhilips both sell for 2x to 1.7x, both companies' book value. Gazprom has a book valuue of $26.90 and only sells for 0.3x its book value and since the company has a return on assets of 8% should trade at book value. Based on the firm above average return on assets, the firm clearly should trade for at least book value or at a premium to book value. At book value Gazprom would sell at $26.90 or at 1.3x book value should trade at $34.97. Gazprom has a value range of $26 to $35 per share. and is clearly selling for 30 cent on the dollar. Offering any investor at least a 25% margin of safety on their investment.
No comments:
Post a Comment